Customer Segmentation & Testing Targeted Promotions

Engagement Overview
A mid-sized regional grocery chain sought to move beyond mass-market promotional blasts and develop a more precise, data-driven understanding of its customer base. The retailer had accumulated two years of transaction and CRM data but lacked a framework for translating that data into actionable customer segments. We took that data and leveraged a combination of Principal Components Analysis and clustering to segment customer populations, piloting a standard A/B testing methodology to gauge the success of a series of promotions targeted at those customer segments.
The Challenge
Our client operated a network of grocery stores serving a diverse suburban customer base. Despite consistent foot traffic and a well-established loyalty program, the marketing team faced a familiar challenge: promotional spend was spread too thinly across heterogeneous customer groups, diluting impact and eroding margins.
The core objective was straightforward — we had to use existing customer data to answer the question: Who are our customers, really? The secondary objective was equally important — we had to demonstrate that a more targeted promotional approach could measurably improve commercial outcomes.

Available Data
The client provided access to its CRM database, containing thousands upon thousands of customer records each enriched with the following attributes:
Demographics: year of birth, education level, marital status, household income
Household composition: number of children and teenagers at home
Category-level spend over two years: wines, fruits, meat, fish, sweets, and specialty items
Channel behavior: number of purchases made in-store, via web, via catalog, and through deal promotions
Campaign history: response to five prior marketing campaigns
Recency: days since last purchase
Methodology & Analysis
Phase 2: Preprocessing and Scaling
Categorical features were label-encoded to enable numerical processing. All features were then standardized using a Standard Scaler, ensuring that variables with larger absolute ranges — such as income and spend — did not disproportionately influence the clustering algorithm.
Phase 4: Unsupervised Clustering
We applied agglomerative (hierarchical) clustering to the PCA-reduced dataset. The optimal number of clusters was determined using the Elbow Method, which evaluates within-cluster inertia across a range of k values.The resulting cluster assignments were mapped back to the full customer dataset and used as the basis for subsequent profiling and targeting.

Our process for customer segmentation followed a four-phase pipeline: data preparation and feature engineering, preprocessing and scaling, dimensionality reduction via PCA, and unsupervised clustering.
Phase 1: Data Preparation and Feature Engineering
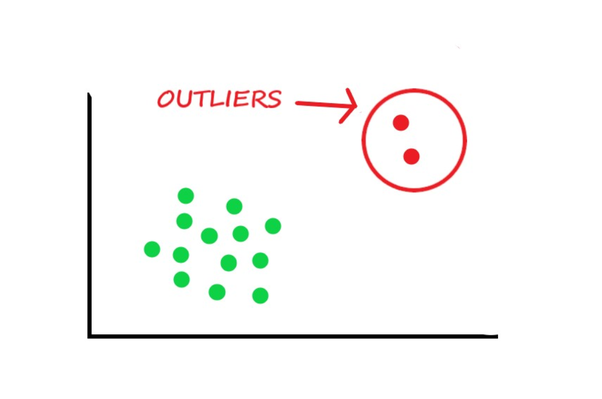
Raw data required several cleaning steps before modeling. Records with missing income values were removed, leaving a marginally smaller dataset. Outliers were also excluded on the basis of their implausibility.
In addition to cleaning, we engineered new features to enrich the representation of each customer.
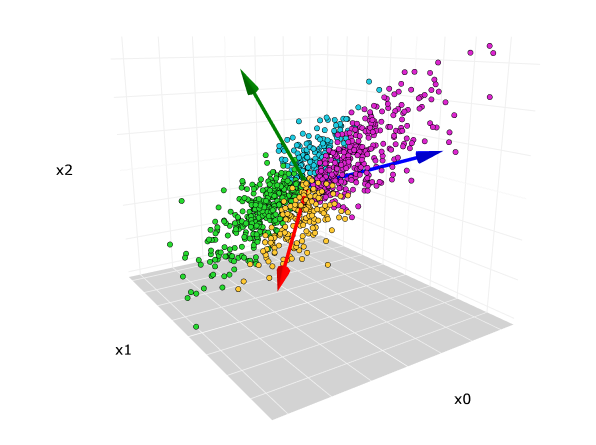
Phase 3: Principal Components Analysis for Dimensionality Reduction
With too many standardized features, direct clustering risks the "curse of dimensionality" — where the proliferation of dimensions makes distance measures less meaningful. To mitigate this, we leveraged Principal Components Analysis, reducing the feature space to three principal components while preserving the dominant axes of variation in the data.
The three resulting components (PC1, PC2, PC3) captured the primary dimensions along which customers differ from one another — broadly reflecting a combination of spend level, income tier, and household complexity. The reduced dataset was then visualized in three-dimensional space to assess the presence of natural groupings.
Customer Segment Profiles & Targeted Promotions

Analysis of the four segments — examined through income-vs-spending scatter plots, category-level spend distributions, purchase channel behavior, and household demographics — revealed four clearly differentiated customer personas.
Armed with four well-defined segments, we collaborated with the client's marketing team to design a tailored promotional offer for each cluster, aligned to the behavioral drivers identified in the analysis.
Cluster A (Deal Seekers): "Spend $60, Save $8" threshold discount — structured to nudge the existing average order value upward while delivering tangible savings
Cluster B (Premium Buyers): Curated wine and specialty bundle — a premium value-add offer positioning the grocer as a quality destination
Cluster C (Budget Shoppers): Everyday essentials loyalty points multiplier — 3x points on staples purchases to reinforce habitual engagement
Cluster D (Constrained Spenders): Family meal plan bundle — multi-SKU combination offer delivering perceived volume value
A/B Testing Promotions
Each segment's customer population was split randomly into a treatment group (receiving the segment-specific offer via email and in-app notification) and a control group (receiving the standard weekly communication with no targeted offer). Sample sizes were calibrated to achieve 80% statistical power at a significance level of α = 0.05, assuming a minimum detectable effect of 3% on average order value (AOV, the primary metric under observation).
The experiment ran over a four-week period covering two standard promotional cycles, minimizing the influence of seasonal variation. While the primary metric was AOV, we included secondary metrics, such as order frequency and total revenue per customer, to track any trade-offs.

Results
The overall weighted average AOV lift of +5.0% was statistically significant at the p < 0.01 level. Effect sizes were consistent across segments, with the highest absolute lift observed in Cluster B (Premium Buyers) — reflecting both the higher baseline AOV and the strong resonance of the curated bundle offer with that group's preferences.
Conclusions

This engagement demonstrated that structured unsupervised learning — when applied rigorously to an organization's existing data assets — can surface commercially actionable customer intelligence without requiring new data collection infrastructure.
The primary insights from this work were:
Customer heterogeneity is substantial and consequential. The four segments identified differ meaningfully in their income levels, household structures, channel preferences, and promotional responsiveness — differences that are invisible under a mass-marketing lens.
Segment-aware targeting outperforms undifferentiated promotion. The A/B test results confirm that matching offer design to segment characteristics produces measurably superior commercial outcomes.
The methodology is scalable and repeatable. The PCA + clustering pipeline can be re-run on a periodic basis (e.g., quarterly) to track segment evolution and detect the emergence of new customer sub-groups.