Preventing Perishable Goods Stock-Outs
Engagement Overview
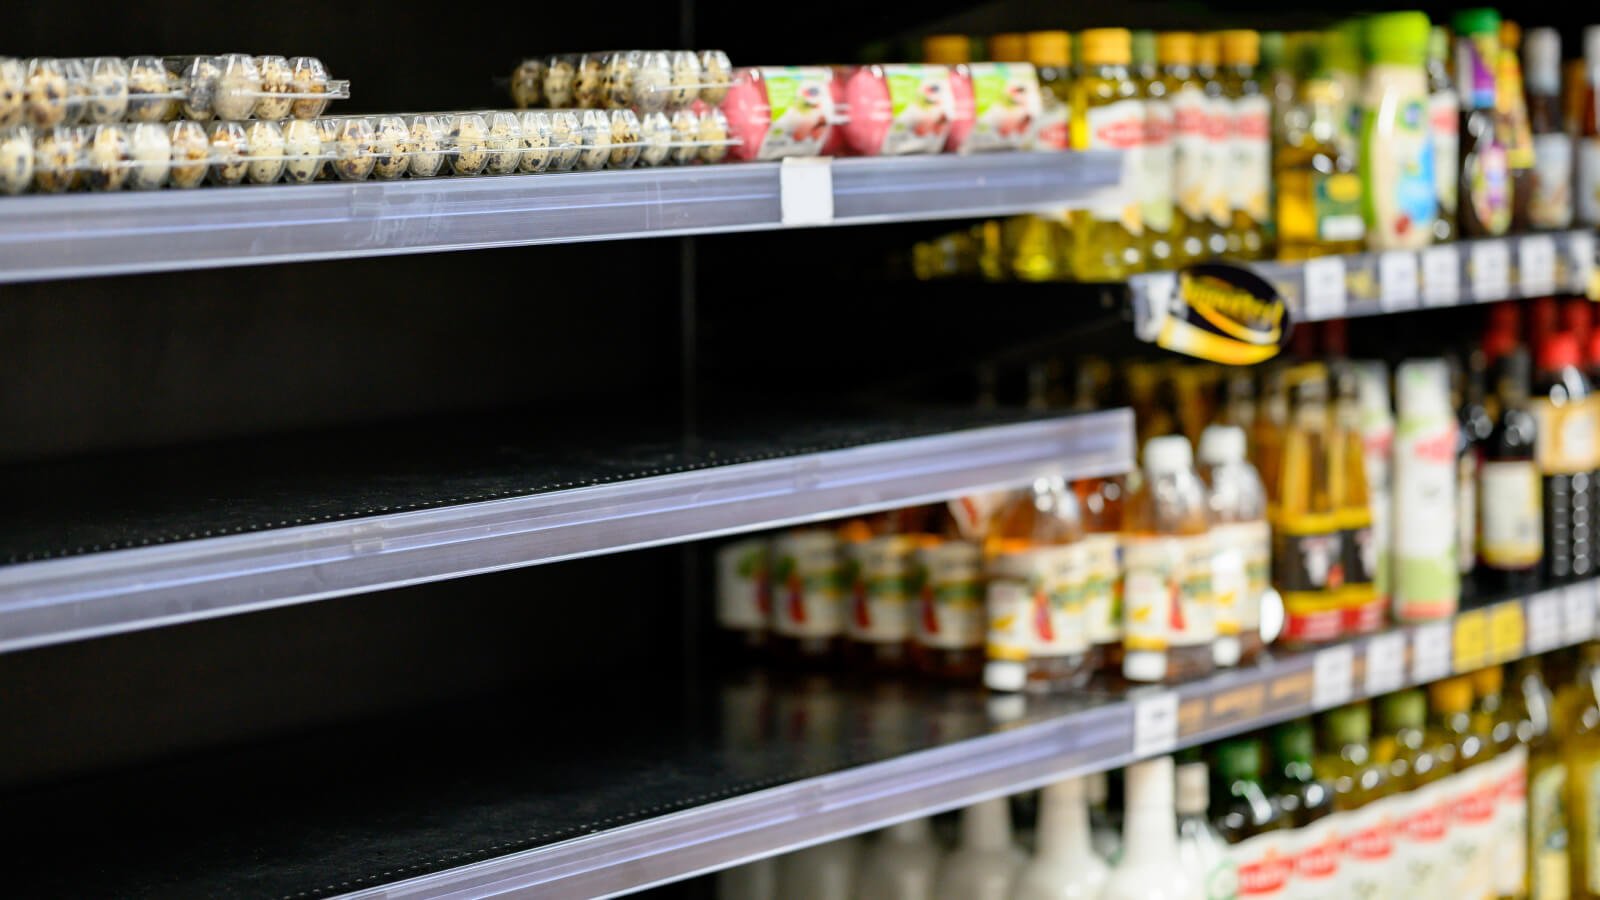
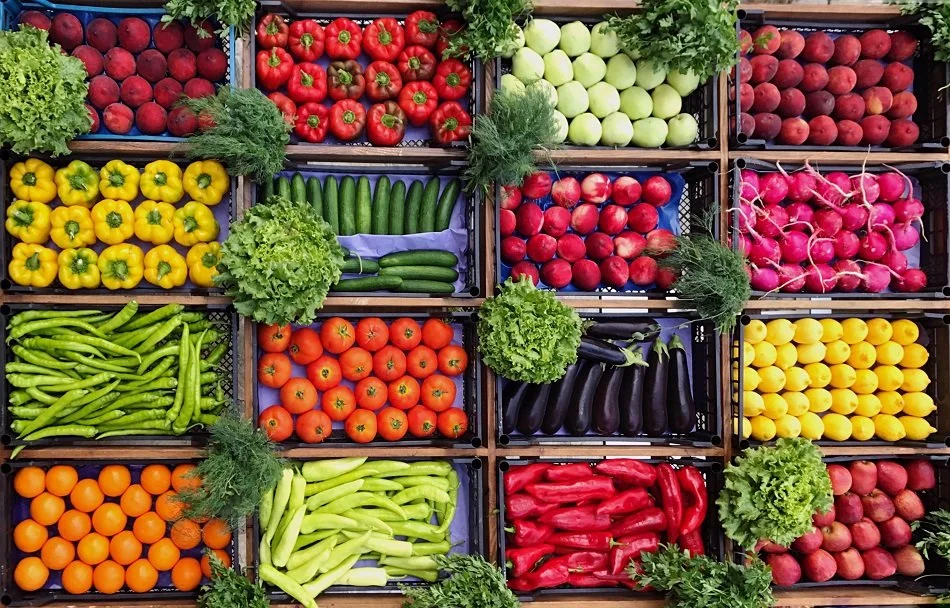
Our client was a regional convenience store chain facing persistent stock-outs and elevated spoilage across their perishable goods category—dairy, prepared foods, and fresh produce. A data-driven engagement redesigned the chain's replenishment model by identifying structural inefficiencies in its supply logic and deploying a predictive stock-out model.
The Challenge
The client's replenishment process relied on static par levels set quarterly, with minimal responsiveness to demand variability driven by day-of-week patterns, local events, or weather. The consequences were twofold: overstocking of low-velocity SKUs drove spoilage costs, while under-stocking of high-velocity items caused frequent, revenue-eroding stock-outs. Store managers lacked the analytical tools to anticipate risk.
Analysis & Methodology
The engagement began with a comprehensive diagnostic of POS transaction data, inventory logs, and delivery records across a representative sample of store locations. Root causes of stock-out events were mapped across SKUs, store clusters, and time periods.
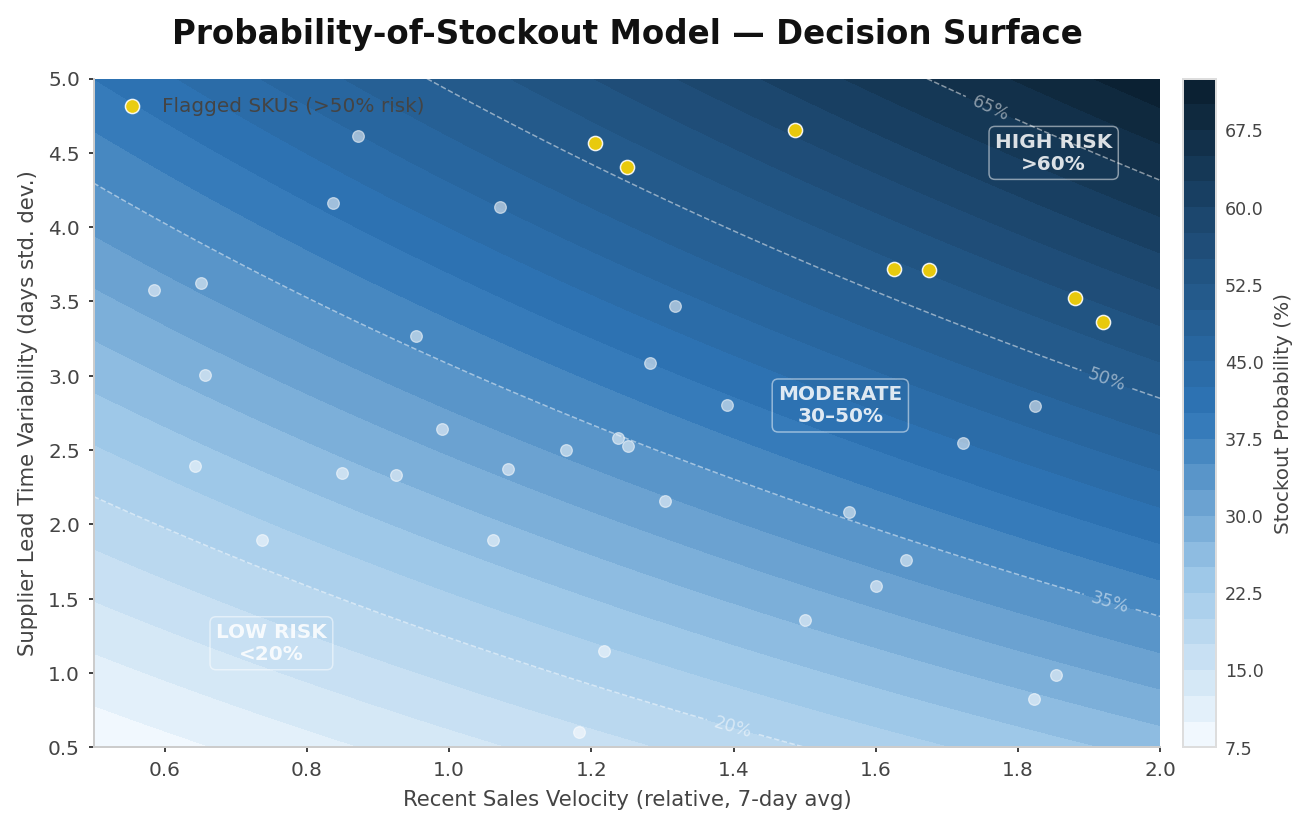
A probability-of-stock-out model was then developed using forward step-wise regression—a method that builds a predictive model incrementally, adding one variable at a time and retaining only those that meaningfully improve predictive accuracy. Starting from a large pool of candidate variables (including day-of-week, recent sales velocity, supplier lead time, and seasonal indices), the model selected the most statistically significant drivers of stock-out risk. This approach produced a transparent, legible model well-suited to operational deployment.
The model was embedded into a daily replenishment alert system, enabling store managers and supply planners to act on predicted risk before stock-outs occurred.
Key Insights
During our comprehensive diagnostic, as well as through our development of the aforementioned stock-out model, we found the following:
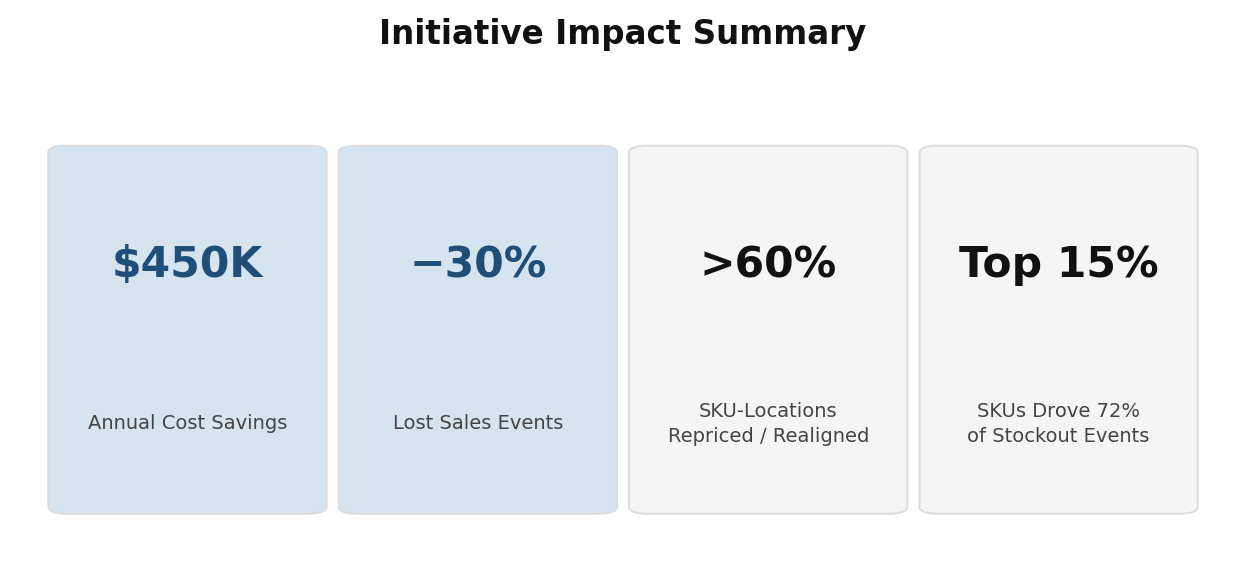
Stock-out frequency was highly concentrated: the top 15% of SKUs by velocity accounted for over 70% of lost sales events
Supplier lead time variability was a primary risk factor, particularly for prepared food items with short shelf life
Day-of-week and proximity to local events were among the strongest predictors of elevated stock-out probability identified by our model
Results
Deployment of the probability-of-stock-out model and associated replenishment protocol changes generated measurable improvements across the perishable goods category:
30% reduction in lost sales events attributable to stock-outs in targeted SKU clusters
Approximately $450K in annualized cost savings, driven by reduced spoilage, lower emergency restocking costs, and recovered revenue
Improved supply planner efficiency through prioritized, model-driven daily alerts replacing manual inventory reviews